|
Today we are going to be learning more advanced GIS Skills
The tutorials for this are online - click on the following links to open the online work Part 1 GIS Story Maps https://www.esri.com/training/catalog/57630436851d31e02a43f0e3/telling-stories-with-gis-maps/ Part 2 Using GIS to solve Problems https://www.esri.com/training/catalog/57630433851d31e02a43eea1/using-gis-to-solve-problems/ http://gisinschools-nz.maps.arcgis.com/home/index.html
0 Comments
In this lesson, you'll re-create the map we explored yesterday. You will start a new map and add the layers you need.
This tutorial has been taken from https://learn.arcgis.com/en/projects/get-started-with-arcgis-online/lessons/create-a-map.htm We want to be able to save our work so we need to sign up for an ArcGIS free trial Make sure you write down your account details so you can use these over the next few weeks. Create a new map Every new map starts with a base map so we need to first find an appropriate base map
Add layers to the map You're ready to start adding layers to the basemap.
In this section, you'll change some of the properties of the layers. You'll give them shorter names, change their position in the list of layers, add labels, and adjust transparency. Layer properties are always accessed in the same way: by pointing to the layer name and clicking an appropriate button or clicking the More Options button and choosing the property you want to change.
Define the map legend When you start a new map, or open a saved map of your own, it opens with the Contents pane showing. When anyone else opens your map, however, it opens with the Legend pane showing. You should think about how you want the legend to look.
Change a symbol You were able to re-create the map's appearance without too much effort because the symbols, such as yellow diamonds for volcanoes and shades of red and orange for hazard zones, were already set when you added the layers. A layer's default display settings, including its style and pop-up configuration, are made by its owner. Once you add a layer to your own map, however, you're free to change those settings.
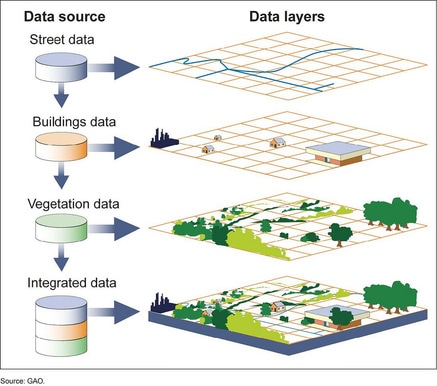
GIS is essentially the laying of information / data onto a base map. It allows large amounts of information to be seen by layering one set of information on to another. The base information is a map of the area being studied.
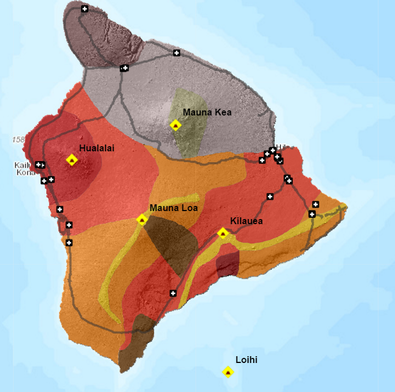
This map shows the layer potential lava flow data onto a base map of an area of Hawaii in order to see which houses are more likely to be affected by a volcanic eruption should it occur. Today we are going to explore GIS to identify how they can be useful to solve spatial problems SC:
We will use two scenarios to explore how GIS work to solve problems Christchurch over time Hazards in Hawaii Climate graphs combine two pieces of information; rainfall and temperature onto the one graph. The bars represent the rainfall in mm and the line represents the temperature in degrees Celsius. The x-axis always shows the months of the year, but there are two y-axes. When interpreting climate graphs we want to identify
 Graph sourced from: http://www.greymouth.climatemps.com/
Your task is to
A more detailed review of the climate of the West Coast can be found in this report produced by NIWA. We are just beginning work on Achievement Standard 91009. This topic explores your geographic understanding of the sustainable use of an environment. We will be looking at farming practices on the West Coast.
Our first task is to understand where we live and you need to explore the following websites Statistics NZ West Coast Profile and West Coast Regional Council. Your task is to create a presentation giving an overview of the West Coast region. |
Angela SeybThis page will provide you with an overview of the current work in GEO111. Categories
All
|
 RSS Feed
